Function
Math
In mathematics, a Function is an expression, rule, or law that defines a relationship between one variable (the independent variable) and another variable (the dependent variable).
A function is a rule for how two variables relate. For each value of x (the domain), there is only one value of y (the range). For example, if y = x + 6, whatever x is, y must be greater than x by the number 6.
A function table shows the values for each pair of variables as the result of the particular function. A function table for the equation y = x + 6 is shown here.
Lesson Outline:
1. What are relations?
2. What are function?
3. Presenting functions as tables and graphs
4. The Vertical Line Test
Do you still remember how to fill in the table of values based on a given graph?
Complete the table of values below.


Learning Outcomes:
By the end of the lesson, you will be able to:
a. Express relations and functions in tables and graphs
b. Differentiate between a relation and a function.
c. Use a vertical test.
Q. What are relations?
Ans: A relation is a set of ordered pairs that represent a relationship.
Ex. Names and their age are a set of ordered pairs that we could put into a table.

Q. What is a function?
Ans: A function is a special type of relation where each input only has one output.
Functions are a way of connecting input valures to their corresponding output values.
The relation is a function if, for every x-value, there is exactly one y- value.


Functions are a way of connecting input values to their corresponding output values.
Ex. Ordering a coffee for $5
Pay $5, and you get 1 coffee.
Pay $10, and you will get 2 coffees,
and so on.
The input affects the output in a predictable way.

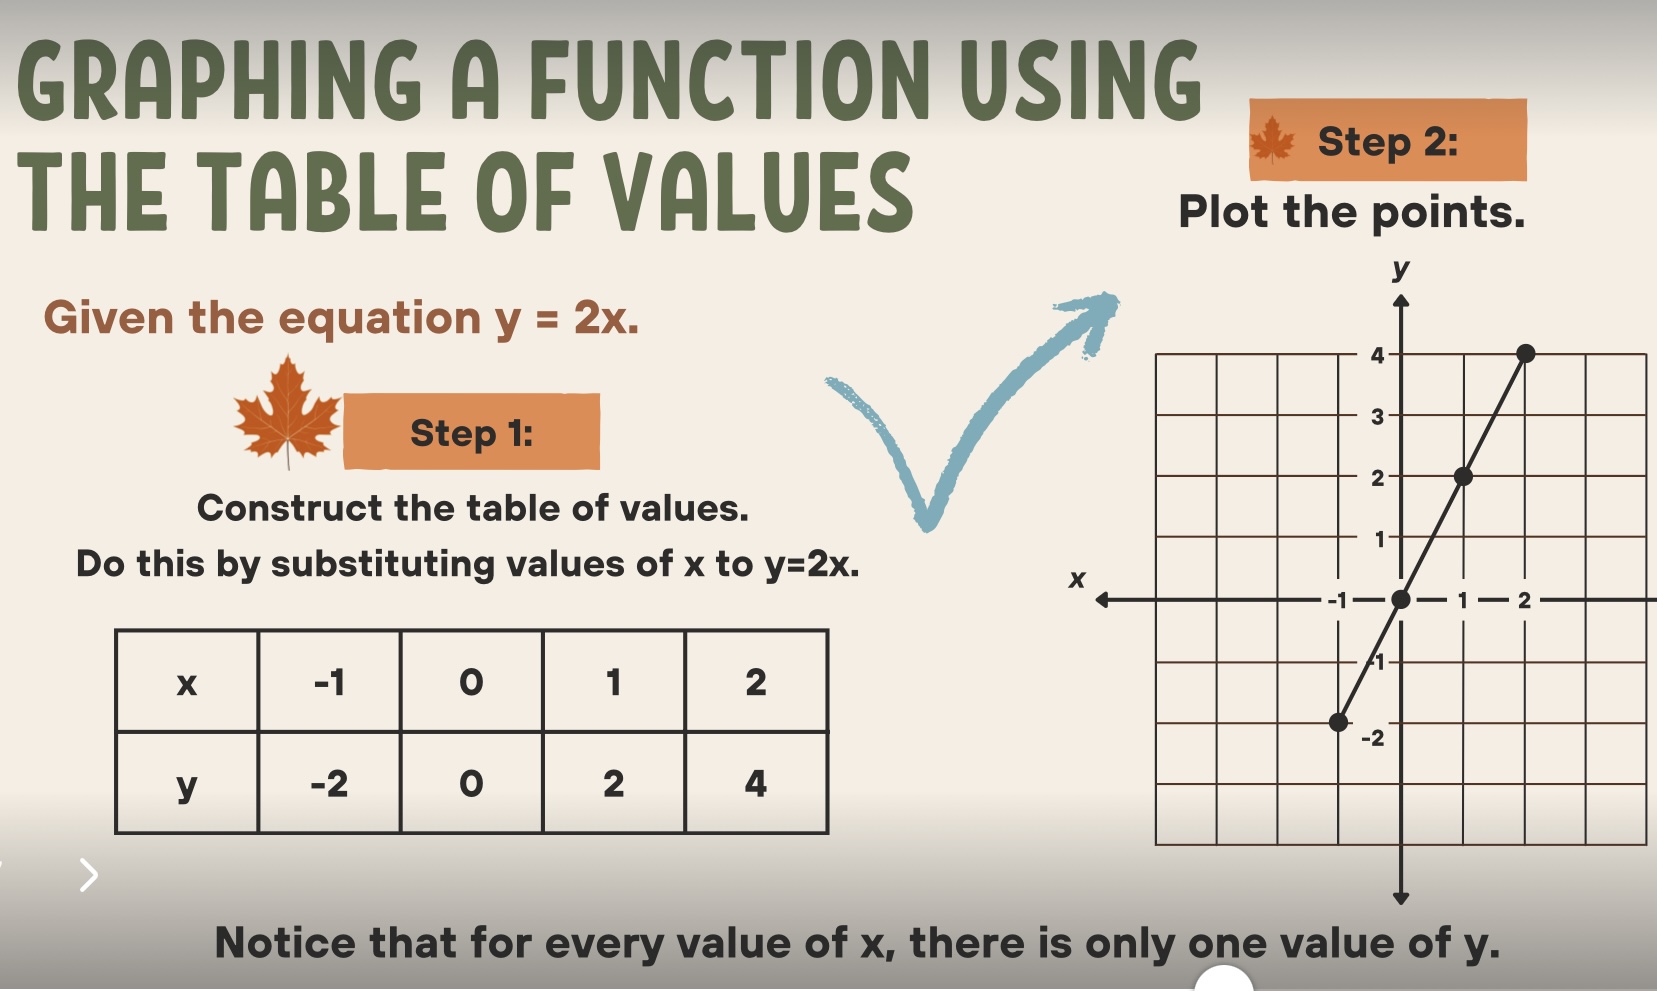
Graphing A Function Using The Table Of Values:
Given the equation y = 2x.
Step 1:
Construct the table of values.
Do this by substituting values of x to y= 2x.
Notice that for every value of x, there is only one value of y.
Step -2:
Plot the points.


Vertical Line Test:
Use the vertical line test to check whether a graph of a relation is a function.
If a vertical line, drawn anywhere on the graph, can touch the graph only once, then it is a function.
If a vertical line, drawn anywhere on the graph, can touch the graph more than once, then the relation is not a function.


A function is a rule that converts one number to another number. If the value of y (called the dependent variable) depends on the value of x (called the independent variable), then we can write the equation.

(read as y equals f of x). In this expression, f stands for function. Think of the function as a machine. Insert the value of x into the input slot, and the value of y comes out of the output slot.
In a particular circumstance, you need to specify which function you mean by listing a formula; for example, f(x) = 4x² defines a function. Then the result (or output) of the function depends on the specific number (or expression) that is used as the argument (or input) to the function.
For this example, f(3) = 4 x 3²=36;
f(12) = 4 x 12² = 576
f(5a) = 4 x (5a)²
4 x 25a² = 100a²
and f(ab) = 4(ab)²
There is a unique value of f(x) determined by each value of x. In other words, if x = 10, then you can determine unambiguously the value of f(10) for any specific function f. However, different values of x might give the same result for f(x). For example, if f(x) = x², then f(10) and f(-10) have the same value (they both equal 100). In the extreme case where f(x) equals a constant value, such as f(x) = 17, then all values of x lead to the same value of f(x).
Sometimes two functions are chained together so that the output of one function becomes the input of another function.
For example, if g(y) = √y and h(x) = 2x, then we can create the function f(x) = g(h)(x) = √2x.
If y = f(x), and x = g(y) for all values of x and y, then g is the inverse function of f. It has the effect of reversing the action of f and returning you to your original number. If f and g are chained together, then f(g(x) = x.
The set of all possible values for the input to the function is called the domain, and the set of all possible values for the output is called the range.


In the graph above, the independent variable is the number of hours worked. The change in the number of hours affects the amount paid.
The independent variable is almost always on the x-axis and is represented by x in equations.
The dependent variable is the amount paid. The amount paid depends on the hours worked. The dependent variable is almost always on the y-axis and is represented by y in equations.
The information in the graph can be represented in a table, showing the values of x and y.
The information can also be shown as ordered pairs (x, y).
A relation is any set of ordered pairs.
A function is a special kind of relation.
Functions assign exactly one value of the dependent variable to each value of the
independent variable.
Let’s assume that x is the independent variable and y is the dependent variable.
To put it concisely:
In a function, there can only be one x-value for each y-value. There can be duplicate y-values but not duplicate x-values in a function.
When there is one and only one y-value for each x-value (no duplicates in y), it is called a one-to-one function.
You can determine if a relation is a function by looking at a table of values.

You can also determine if a relation is a function from its graph using the vertical-line test.
The vertical line test can be done with any straight object, like a pencil.
Pass the pencil vertically across the graph, and if it crosses the line of the relation more than once, it is not a function.
(By the way, a one-to-one function also passes the horizontal-line test.)

Function:
The pencil never crosses a line more than once at a time. Also, a one-to-one function would pass the horizontal line test.

Not a function:
The pencil crosses the line twice at the same time, which means that values of x are repeated.


Function Rules:
A function rule is an equation that describes a function. A typical function rule looks something like this:

Plug in values for x to get values for y. Sometimes a domain, in set brackets, is given and you are expected to find the range.
Example:
Given the domain {0, 2, 4} and the function rule y = 3x + 2, find the range.
y = 3(0) + 2 = 2
y = 3(2) + 2 = 8
y = 3(4) + 2 = 14
The range for the function rule y = 3x + 2 is {2, 8, 14}.
Sometimes the equation is written with function notation, f(x), instead of y. It means the same thing but shows what input value was used to find the output. To read f(x), say f of x. The previous function rule would look like this: f(x) = 3x +2.
Real-life situations can sometimes be modeled with functions. Situations where the independent and dependent variables increase or decrease together and situations where one increases while the other decreases are often functions.
Examples:
Minutes elapsed in a basketball game vs. total points scored
Time a candle has been burning vs. the height of the candle
Cost of dinner vs. amount of tip at 15%
Question:
Given the domain {0, -2, -4} and the function rule f(x) = x2 + 1, find the range.
A. {0, -2, -4}
B. {0, 4, 16}
C. {1, -5, -17}
D. {1, 5, 17}
Inverse Functions:
In an inverse function, the x-values (domain) and y-values (range) are switched. The function must be a one-to-onefunction in order to have an inverse function. The range becomes the domain when the function is inverted and, as you
know, the domain can not have duplicate values.
Example:

Question
Which set of ordered pairs represents the inverse of the function shown?

A. {(-4, 6); (-1, 3); (0, 2)}
B. {(6, -4); (3, -1); (2, 0)}
C. {(4, 6); (3, 1); (2, 0)}
D. {(6, -4); (-1, 3); (0, 2)}
How is a Linear Function Different from Other Functions
A linear function produces, not surprisingly, the graph of a straight line.
Some functions produce curves, others make
zigzag lines, and still others make v-shapes.
Linear functions are one-to-one functions.
In a linear-function rule, the highest power of x is one.
No higher powers of x can be used if a function is linear.
(Think about what happens when negative numbers are squared
and you will begin to understand our next chapter, quadratic functions.)
Linear Functions vs. Nonlinear Functions
f(x) = x + 8 f(x) = x – 1
f(x) = 4x – 9 f(x) = x + 4x + 4
f(x) = -1/2 x + 2 f(x) = x + 1
Horizontal lines are also linear functions, although they do not have an x-value.
A horizontal line comes from any
equation like y = 3 or y = 6.
The line crosses the y-axis at the number given and is horizontal;
for any value of x, the y value is always the same.
2
2
3
Graphing linear equations is quick and easy.
If you are unsure how to graph them, see the sections below to learn more.
GraphingLinear Equations from a Table
If you are given a table of values for x and y,
the values are ready to be used as ordered pairs (x, y). Remember the x-value
tells you the horizontal movement on the graph,
and the y-value tells you the vertical movement on the graph.
If you have to draw your own coordinate plane,
be sure to include enough grid spaces to be able to graph all of the points.
Sometimes it is easier to count by twos or fives,
depending on the information given in the table.
Count using the same
interval the whole time.
Once you have marked all the points on the graph,
use a ruler to connect the dots.
Example
Graph the function shown in the table.

GraphingLinear Equations from a Rule:
If you are given a function rule, it is your job to create the table of x and y values.
Then graph the f(x) and x values as
ordered pairs just as you would if you were given a table of values.
Choose at least three values because, if you make a calculation error,
you can easily see that your three points don’t
make a straight line. Two points always make a straight line, so mistakes are harder to see.
Choose numbers that are easy to work with in the equation.
Avoid fractional answers for y whenever possible.
Zero is always a good choice for x;
It is also a good idea to choose at least one negative number as part of the input.
Example
Graph the function

Constant Rate of Change:
Linear functions have a constant rate of change; that is why they make a single straight line when graphed.
The reverse is also true: if a table of values or a graph shows a constant rate of change, then the function it represents is linear.
The rate of change is also known as slope.
The rate of change is the change in y divided by the change in x. Algebraically, you can use the delta symbol (Δ) to represent change, so that it looks like:
Rate of Change = 🛆y/🛆x
How can you tell if a function has a constant rate of change?
Check the following table:
From a Graph From a Table
A function has a constant rate of change if, for each amount traveled across, you travel the same amount up (or down) to reach the line again. It looks like a stair
steps if you draw them on the graph.
In a table, there is a constant rate of change if the ratio of the difference between entries on the x-side and y-side stays the same. This is easier to show with tables than to write, so let’s take a look at some examples.

Linear-Function Rule:
Linear-function rules, which are also called linear equations, can be written from looking at the x and y values given in a table.
Writing function rules is really the same process as figuring out the rule for any pattern.
For example, in a pattern written like this: 3, 7, 11, 15, 19, …, you figure out by trial and error that it seems to work if you add four to get to the next number.
With linear functions, the rule could be slightly more complicated than x + 4 (although not always!), but if you know the table is showing a linear function, then you also know that x can’t be raised to any power except one.
(You just learned how to determine if the function is linear by looking at the constant rate of change; sometimes the problem will just state for you that the function is linear.)
The rate of change comes in handy another way. The rate of change is the number by which x is multiplied in the function rule. Then figure out what to add or subtract to get to the number in the y-value column. It should be the same number each time you move through the table.
You can try the guess-and-check method first; you can often come up with the rule fairly easily on your own, especially if x is not multiplied by a fraction.
Let’s take a look at a few examples. Write the function rule for each linear function.
Graphing Linear equations:
A linear equation is an equation that creates a straight line when graphed on a coordinate plane. To graph a linear equation, create a function table with at least 3 ordered pairs. Then, plot these ordered pairs on a coordinate plane. Draw a line through the points. Some points for this linear equation are in the table to the right.
y = x/2. + 1
These points are plotted on the line graph at the right.
Slope & y-Intercept:
Every straight line can be represented by the equation y = mx + b, where m is the slope of the line and b is the y-intercept.
The slope of a line is its steepness or slant. It is calculated as follows:
m = change in y-value/change in x-value
= y2 - y1/x2 - x1
where (x1, y1) and (x2, y2) are two different points on the line.
The y-intercept is the value of y at the point where the line crosses the x-axis (that is, where x = 0).
In the graph to the right, the slope (m) for the line = {3 - 1}/{2 -1} = 2.
The line intersects the y-axis at the point (0, -1), so -1 is the y-intercept.

Q. Which linear-function rule correctly represents the data in the table below?
x y
-2 -7
0 -1
1 2
4 11
A. y = x – 1
B. y = 2x + 3
C. y = 4x – 2
D. y = 3x – 1
Review:
1. An independent variable (x) is the variable that changes; the dependent variable (y) is affected by the change in the independent variable.
2. A relation is any set of ordered pairs.
3. A function is a special kind of relation. In a function, there can only be one x-value for each y-value.
4. There can be duplicate y-values but not duplicate x-values in a function.
5. When there is one and only one y-value for each x-value (no duplicates in y), it is called a one-to-one function.
6. You can determine if a relation is a function by looking at its table of values or by using the vertical-line test on the graph of the function.
7. A function rule is an equation that describes a function, and it may use the function notation f(x).
8. In an inverse function, the x-values (domain) and y-values (range) are switched.
9. A linear function produces the graph of a straight line, which you can make from a table of values or from a linear function rule.
10. In a linear-function rule, the highest power of x is one. There are no x2 or x3 in a linear function.
11. Linear functions have a constant rate of change (slope), which is the change in y divided by the change in x.
It can be represented as Δy/Δx.
12. The constant rate of change can be determined from the graph of a function or a table of values.
13. Writing a linear-function rule from a table of values can be done with a combination of mental math and by using the rate of change to figure out how to get from x (input) to y (output).