Graph Points on the Coordinate Plane
Quadrant-1
Math
How do you name a point on a coordinate Grid?
A map shows the location of landmarks and has guides for finding them. In a similar way, a coordinate grid is used to graph and name the locations of points in a plane.
You can use ordered pairs to locate points on a coordinate grid.
A coordinate grid has a horizontal x-axis and a vertical y-axis. The point at which the x-axis and y-axis intersect is called the origin.
A point on the grid is named using an ordered pair of numbers. The first number, the x-coordinate, names the distance from the origin along the x-axis. The second number, the y-coordinate, names the distance from the origin along the y-axis.

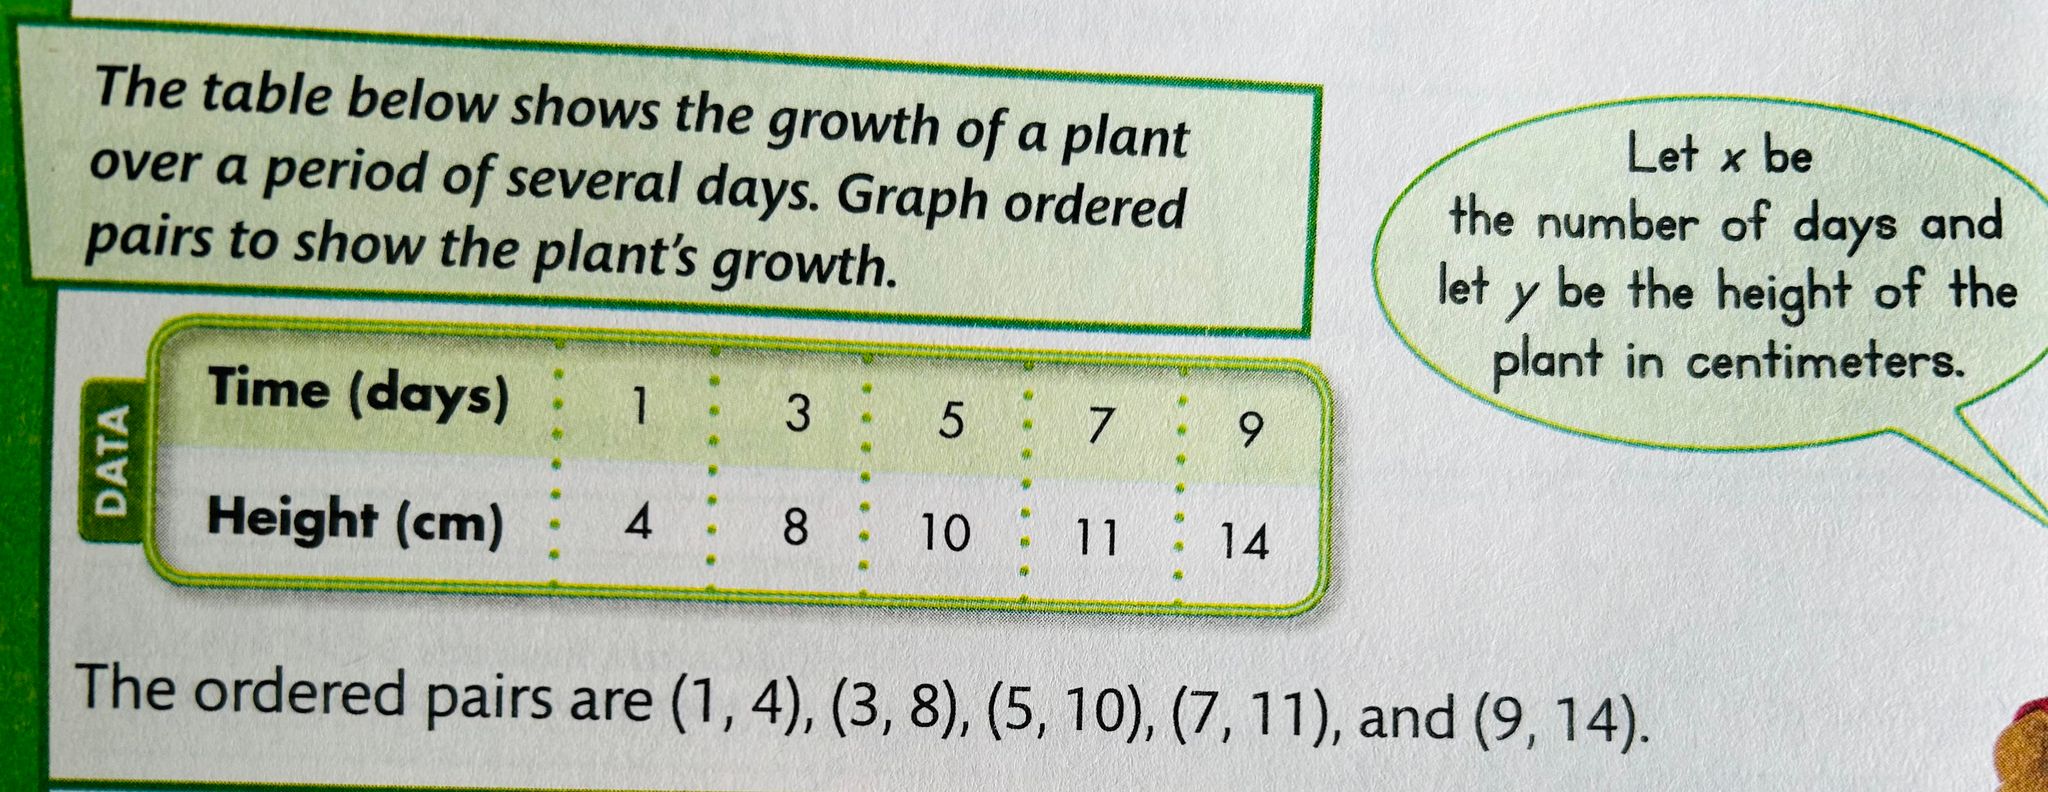
The table below shows the growth of a plant over a period of several days. Graph-ordered pairs to show the plant's growth.
Times (days) 1 3 5 7 9
Height (cm) 4 8 10 11 14
Solution:
Let x be the number of days and let y be the height of the plant in centimeters.
The order pairs are (1,4), (3,8), 5, 10), (7,11), and (9,14).
Step 1
Graph the first point (1,4).
Start at (0,0). Move 1 unit to the right along the x-axis. Then move 4 units up.


Step-2:
Plot the rest of the ordered pairs from the table. Use a ruler to connect the points.

Based on the data, how tall was the plant on day 4? Day 8?
Q. Both Ann and Bill earn the amount shown each week. Ann starts with no money, but Bill starts with $5. How much will Bill have Ann has $30?
Represent this situation using a table and a graph.
Solution:
You know that when Ann has $0, Bill has $5.
Make a table showing how much money Ann and Bill have after each week.
Week Start 1 2 3 4 5
Ann's earnings in $ 0 3 6 9 12 15
Bill's earnings in $ 5 8 11 14 17 20
Let x = Ann's earnings and y = Bill's earnings.
Plot the ordered pairs from the table. Draw a line to show the pattern. Extend your line to the point where the x-coordinate is 30. The corresponding y-coordinate is 35.

So, Bill has $35 while Ann has $30.
Q. Six clowns apply for a circus job. The specific job requires the clown to have a clown shoe size of less than 15 inches and to be shorter than 5 ft 8 in tall.
How many clowns meet the size requirements for the job? Complete the graph below to help you decide.
Clown Tippy Yippy Dippy Zippy Fippy Gippy
Show 15 13 13 16 12 16
Height 5'9'' 5'10'' 5'3'' 5'2'' 5'4'' 5'11''

What do the numbers and symbols in the problem mean?
How are the numbers or quantities related
How can I represent a word problem using pictures, numbers, or equations?
Solution:
In the table, the x-coordinate is in the left column and the y-coordinate is in the right column. Use the table to plot the ordered pairs. Then draw a line to connect the points.
x y
1 1
2 4
3 7
- Q.1. What does the point (15,4) represent on the graph at the right?
- A. The ant crawled 15 meters in 19 seconds.
- B. The ant crawled 15 meters in 4 seconds
- C. The ant crawled 4 meters in 19 seconds
- D. The ant crawled 4 meters in 15 seconds
- Q.2. What does the point (20,5) represent on the graph?
- A. In 20 seconds, the ant crawled 5 centimeters
- B. In 20 seconds, the ant crawled 5 meters
- C. In 5 seconds, the ant crawled 20 meters
- D. In 5 seconds, the ant crawled 15 meters


