Pie Charts
A convenient way of comparing data is by using pie charts. In pie charts, a circle is divided into parts and then the parts are compared. Since it looks like a pie that has been sliced into pieces, such a diagram is known as a pie chart.
* Pie graphs are convenient for displaying information of the type that are measures of part of a whole, given as fractions, ratios, or percentages.
* A pie chart is constructed by dividing a circle into different sectors.
For example, the pie chart given alongside shows the different fruits that a fruit seller keeps at his shop. We can see that out of all the fruits in the shop, mangoes are the most in number, followed by pears, apples and then oranges.
The circle represents the total number of fruits surveyed.
The pie chart shows the favourite pastimes of 160 students.
Study the pie chart and answer the following questions.
a) What is the favourite pastime of most number of students?
b) Between indoor and outdoor games, which is more popular?
c) Between outdoor games and reading, which is less popular?
d) How many students chose reading as their favourite pastime?
Ans:
a) In the pie chart, reading covers the most area. Thus, reading is the favorite pastime of most number of students.
b) In the pie chart, outdoor games covers more area than indoor games. Thus, outdoor games are more popular than indoor games.
c) In the pie chart, outdoor games covers less area than reading. Thus, outdoor games is less popular than reading.
d) In the pie chart, reading covers half of the area. The entire circle represents 160 students. Half of 160 is 160/2 = 80. Thus, 80 students chose reading as their favourite pastime.
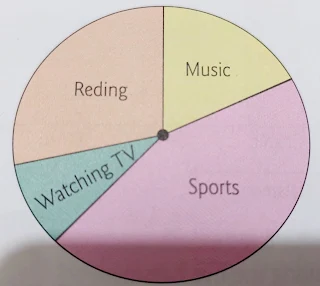
Q. Study the given pie chart and answer the following questions.
a) Which is the most popular hobby among the students? sports
b) Which is the least popular hobby among the students? watching TV
c) Between music and reading, which is more popular? reading
d) Between reading and watching TV, which is more popular? Reading
e) How many different hobbies do the students have in all? 4
Q. The boys of grade 5 of St. Mark's School were asked to pick their favourite sport. their response is represented in the following pie chart.
a) Which is the most popular sport among the boys? Cricket
b) Which is the least popular sport among the boys? Tennis
c) Between tennis and badminton, which sport is more popular among the boys? badminton
d) Between football and cricket, which sport is more popular among the boys? cricket
Q.1. A survey is conducted to find out which of the four ice-cream flavours, chocolate, yam, mango and vanilla, the students in a class prefer. The pie chart shows the results of the survey.
i) If one-quarter of the class prefers yam, state the angle of the sector that represents this information.
ii) Find the angle of the sector that represents the number of students who prefer vanilla.
iii) If 5 students prefer mango, find the total number of students in the class.
iv) Express the number of students who prefer vanilla as a percentage of the total number of students in the class.
Solution:
i) If one-quarter of the class prefers yam, state the angle of
the sector that represents = 90
ii) Sum of angles = 360
Total number of students who prefer chocolate, yam, mango = ( 120 + 90 + 50)
= 260
The number of students who prefer vanilla = (360 - 260)
= 100 Ans.
iii) If 5 students prefer mango,
so the total number of students in the class = 360/50 X 5
= 36 Ans.
Free WorkSheet you can download:
Q.2. The pie chart shows the sources of revenue of a publishing company.
i) Express the revenue the company earns from newspapers as a percentage of the total revenue of the company.
ii) Express the revenue of the company earns from magazines as a percentage of the total revenue of the company.
iii) If the revenue the company earns from books is 17.5 % of the total revenue of the company, find the value of x.
Solution:
Q.3. The pie chart shows the nutritional composition of a food product.
i) Calculate the value of x.
ii) Express the amount of fat as a percentage of the components of the food product.
iii) Given that a food product contains 120 g of carbohydrates,
calculate the mass of the food product.
Solution:
i) 144⁰ + 9x⁰ + 2x⁰ + x⁰ = 360⁰
12x⁰ = 360⁰ - 144⁰
= 216⁰
x⁰ = 18⁰
x = 18
ii) Angle of sector representing the amount of fat in the food product
= 2 x 18⁰ = 36⁰
Required percentage = 36⁰/360⁰ x 100%
= 10%
iii) The angle of the sector representing carbohydrates is 144⁰ and
this constitutes 120 g.
Mass of the food product = 360⁰ / 144⁰ x 120
= 300 g
i) Find the value of x.
ii) Express the amount of apple juice in the fruit punch as a percentage of all the components in the fruit punch.
iii) Given that a jar of fruit punch contains 759 ml of cranberry juice, find the amount of fruit punch in the jar.
iii) The angle of the sector representing cranberry juice is 237.6⁰


